

Networks, Network Performance, and You
Whether your customers are playing a video game with their friends from across the world, talking with their relatives in another country, or working from home, anything that goes wrong with the network between the customer and what’s important to them is a cause for concern. If your customers can’t make the network perform, your application is simply not going to work.
But Networks are complicated. Between your customer and the service they want to access sits miles and miles of cables and wireless distance, routers and switches, and network exchanges. Anything going wrong can create all sorts of connection problems, making your desired service unusable. Being able to troubleshoot network performance and understand the issues is essential. How do you measure network performance so that you can fix the issue?

Key Network Performance Metrics to Measure
When your customers complain about freezing video or slow download speeds, you need to be able to troubleshoot the network. There are several key network performance metrics that you need to examine.
Latency
Information sent through the network takes time to go from the user to the data center. This time is called “latency”, and it measures the number of milliseconds it takes from when a packet is sent from you to when your service receives the packet. here’s also the return time it takes for the service to send a packet to you. The Round Trip Time (RTT) is the sum of both of those.
In the networking world, time and distance correlate tightly. So a long RTT means that you are physically very far away from the service you want to use, and a short RTT implies that you are physically close to the service.
The closer you are to the service, the less likely that something will go wrong. The further you are, the greater the likelihood of errors. When you’re talking halfway around the world, like New York to Delhi in India, the only question is how much is going wrong, not if something will go wrong.
Jitter
After latency, the next question is regularity. If the first packet you send out takes 100ms to reach your desired service, will the second one also take 100ms? Or will it take longer, like 120ms? If every packet takes the exact same amount of time between being sent and received, the jitter is 0. If every packet takes a different amount of time, there is jitter. If every packet takes a different amount of time, and that time difference is really big, then there is a lot of jitter.
Packet Loss
One cause of jitter is packet loss. If you send out one packet to your desired service and it doesn’t arrive, your device has to wait to figure out that it’s timed out, and must retransmit that packet. So from the service’s perspective, it thinks things are fine, since it received one packet, but from your device, it knows it sent two, and all of a sudden there’s a long time between when it first tried to talk with the service and the service responded, so it calls this variability in time jitter.
Throughput (aka “Bandwidth”)
When there is jitter and packet loss, then throughput goes down. Throughput is just the amount of data which can be sent per second. If every other packet is lost, then observed throughput is just half of what it would be if no packet was lost.
How do you know the state of your network?
You have to measure. Fortunately, there are a lot of available network performance tools available which are free to use, in common use, and will tell you an awful lot about what’s going on. Each tool tells you something a little different than the others, and each one specializes in a certain aspect of overall network performance.
- iPerf
- iPerf has to be run on both a device and a server, and it measures throughput between them.
- Speedtest by Ookla
- Speedtest will show you your observed throughput between Ookla’s servers and your device. This is the bandwidth your device actually sees, so it’s net of all possible loss and jitter your network may have.
- Packet Loss Test
- Packetlosstest.com tells you your device’s packet loss, latency, and jitter from within your web browser. If your service isn’t accessible from a web browser, you can still use it to see a part of your network, even if not the whole of it. And again, this is between Packetlosstest’s servers and your device.
- MTR
- MTR is a wonderful tool which shows the network path and status between your device and desired service, but it’s very technically oriented and lacks the sort of user interface the other tools offer.
- Netperf
- An oldie-but-a-goodie. Netperf consists of a client and server, you run the client on your device, usually a computer, and the server on the server you’re trying to talk to. It takes some expertise to use this tool, but it’s worth the effort.
But what can you do about it all? If you start to measure and monitor and discover that there’s problems with packet loss, jitter, or latency, what is there to be done?
Use Subspace.
Subspace has designed and built a Network-as-a-Service, you can think of it as a parallel Internet which is faster and more reliable than the general Internet. This means not just lower latencies than the Internet, it also means reduced jitter and packet loss, so it’s a global network which simply works better.

How can you use it?
Let’s take our tool iPerf. We’ll bring up iPerf on a server in Amazon’s cloud. Then we’ll bring up an iPerf client on a local laptop. Then the secret sauce: we’ll create a Subspace PacketAccelerator between the laptop and the server. And we’ll know by how much Subspace was faster by running iPerf first over the Internet, and then over the Subspace PacketAccelerator.
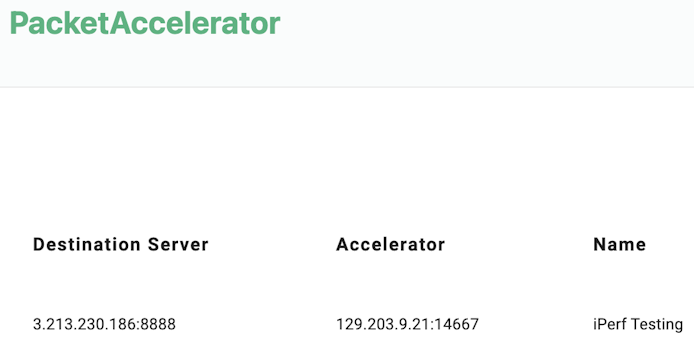
First, let’s create the PacketAccelerator (sign up for free here):
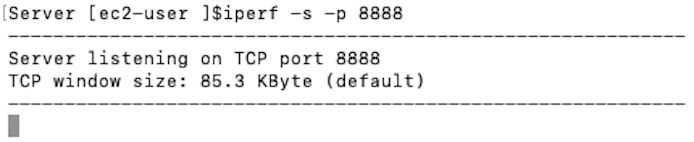
Then let’s start up iPerf on the server:
With iPerf on the server, let’s start the iPerf client on the laptop, and connect directly over the Internet to the iPerf server:
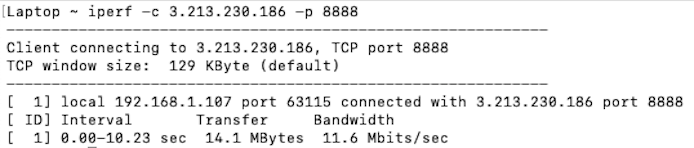
It completes, and returns an observed bandwidth of 11.6 Mbps.
Now let’s run the iPerf client on the same laptop, but direct it to use the Subspace PacketAccelerator instead:
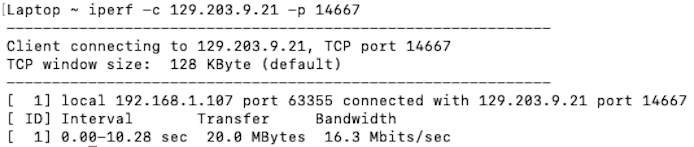
And sure enough, the PacketAccelerator is faster, achieving 16.3 Mbps instead of the 11.6 achieved over the public Internet.
Wait, so what is Subspace?
Subspace provides real-time application publishers with a platform to operate, deploy, and scale their software as a network platform as a service. Our groundbreaking real-time network infrastructure and services platform provide the lowest latency, most reliable real-time, and fully controllable network possible for the world’s biggest applications. On Subspace, real-time applications see an expansion in usable latency, larger user pools, reduced user churn, and broader geographic reach—leading to a steep uptick in engagement across the application’s ecosystem.
Subspace delivers the experience users deserve—across the world and across all titles and platforms. Try Subspace out for free now.